So This is CS!
Eric Allatta
Created: 2022-05-10 Tue 12:45
Welcome to So this is CS!
Press S for speaker notes
Press O for slides overview
About Me
- Husband to Jill and Father to Joy (11), Bruce (6), and Rose (18m)
- Freelance designer, builder, teacher
- 10 years in NYC public schools
- Founding computer science teacher of the Academy for Software Engineering

The Big picture
Particpants will…
- engage in hands-on learning through a variety of computing tools and classroom activities adaptable for a range of ages,
- form connections between CS ed curricula and core academic subjects,
- and solve school-based problems with spreadsheet data engineering.
The Plan
Part 1
- Computing in the News
- Computers
- The Internet
- Portfolio Sites
Part 2
- Algebra
- Spreadsheets
- Data Science
- Programming
Anchor Doc + parking lot
Roles
Roles
Roles describe areas of focus during team or group activities.
A person can focus on more than one role or a role can be divided between multiple people.
More roles can be added but the core roles should always be present.
Roles
- Reporter
- Time keeper
- Facilitator
- Global roles
- Reporter
- maintain parking lot,
- record and report back,
- monitor chat
- Time keeper
- monitor lecture length
- monitor break length
- call out timing alerts, convey pacing consensus
- Facilitator
- Local Roles
- Reporter
- record and report team conversation
- special focus on parking lot questions
- Time keeper
- keep us honest
- special focus on timing of activities and balanced group participation
- Facilitator
- know what "we are supposed to be doing right now"
- special focus on tasks, deliverables/goals/objectives, and flow
Notice & Wonder
Notice means what do you see. Call out the obvious. Make simple observations. Go for quantity.
Wonder means begin an idea and consider possibilities. Wonderings are questions with their possible answers.
Computing in the news
Resources
Resources
An artificial intelligence (AI) software solution developed by Intel and Classroom Technologies to identify students' emotional states is generating controversy in the context of ethics and privacy.
Intel Develops AI to Detect Emotional States of Students - Tom's Hardware 2022-04-27
Resources
University of California, San Diego (UCSD) computer scientists have developed algorithms to keep offensive speech from being generated by online chatbots.
Cleaning Up Online Bots' Act—and Speech - UC San Diego News Center 2022-04-25
Resources
Robots are socialize with nursing home residents, telling them jokes and leading their yoga classes. Can Robots Save Nursing Homes?
Resources
The app-analytics firm Sensor Tower Inc. found that 1 out of 10 mobile games used bots at the beginning of 2016, a figure that has risen to 7 of the 10 most-played mobile games.
Friend or Bot? Phony Gamers Leave Players Feeling Betrayed - The Wall Street Journal 2022-04-25
Resources
University of Georgia researchers created a model to help identify locations best suited for conservation. Improving Georgia Land
Connections
Let's talk about computers
Computers
- consume data (which includes instructions),
- transform it using instructions, and
- return some useful result.
From person to machine
The history of math and science, of celestial navigation, understanding the cosmos, and exploring the world around us,
Progress was made by taking large numbers of observations and searching for patterns;
All examples of data analysis and computations –
Long before what we now think of as a computer.
From person to machine
Mechanical aids like the abacus and rote algorithms add mechanical memory to the computation process.
From person to machine
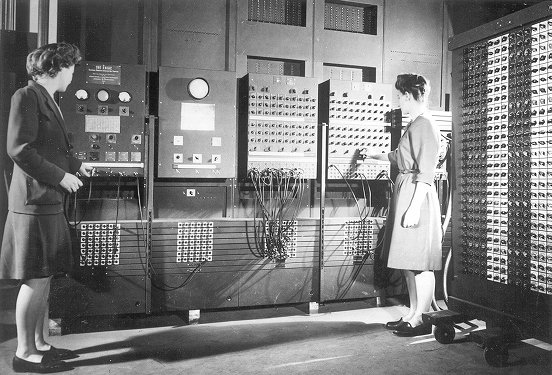
First accomplished by human number crunchers later by electronic
computers
Switches
Flashlights, Telegraph, Boolean Algebra
On/Off languages, binary languages, binary algebra
Electronic and photonic switches are fast.
Translate computational problems into binary problems and give it to the machine
Structure
Programming a computer means working with the structural precision required by computers. Computers consume data, apply instructions to transform that data, and produce results in some form that we can use.
Turing
In 1936 Alan Turing described a machine that the could take an infinite list of data (memory) and a finite list of instructions to implement any algorithm.

Connections
Resources
- Code: The hidden language of computing machines
- Nand2Tetris
- Mouse
- ACM TechNews
- How I discovered six pioneering women who helped create modern computers and why we should never forget them
See speaker notes for additional context
Let's talk about the internet
How am I Connected Boggel
How to play
Set a 1 minute timer Record all of the means/purposes you used to connect to the internet. Earn 1 point for anything not listed by other players
Code.org internet simulator
Internet Simulator Overview
Activity Explore the Simulator
- Simulator
- First Simulator
- Context
- Whole group
- Setup
- Connect to your partner via our first simulator
- Groups
- anchor doc groups heading
Activity Explore the Simulator
Activity Send/Receive a Bit
- Simulator
- Second Simulator
- Context
- Teams
- Setup
- Choose two team members to connect. Share screen of one connected member.
- Groups
- anchor doc groups heading
Activity Send/Receive a Bit
Activity Send/Receive a Word
Activity Send/Receive/Confirm a Word
Protocols and Abstraction Layers
Do one job and don't repeat yourself!
Packets and Redundancy
So how do messages get from one place to another?
Redundancy
Undersea cables

Passwords
Connections
Resources
Let's talk about web creation and portfolio sites
Choosing tools
Motivating Web Creation
Google docs rule the academic lives of many students.
Preformatted docs are often used to scaffold learning products.
Freedom with structure offers ownership of digital creations.
Integration Tips
- Offer web creation skills to other teachers as an alternate work product format.
- Work with students to create a home for all of their work products.
- Simplify assignment submissions by having students create pages to on their site for different assignments to simplify submission and develop a portfolio.
Structure documents
Can be read by a computer
Describe the meaning of different parts rather than show
Markup languages
- A lighter introduction to structured text
- HTML is a markup language, not a programming language
- Markup means using structure to tell a computer what things mean
- Markup is an alternative means of editing documents to wysiwyg editors like Word, Docs, Pages, etc.
HTML isn't the only option
Symbols and Syntax
Computers need data to have structure.
Structures are repeated patterns in data that a computer can be told how to process.
HTML is a language that uses a system of tags to describe the role of different posts of a document.
Hyper text
HTML Tags
Activities
Create a webpage from a google doc
Try markdown
Host a website on github pages
- Follow a tutorial to create a GitHub Pages site
- http://jmcglone.com/guides/github-pages/
Examples
Let's talk about email
Locations: labels, tags, folders
Folders remind us of putting a piece of paper in a filing cabinet.
Files are an idea. Another idea is to put one or more label on each item and to collect together items with the same label when we need them.
In a labeling system items can exist in more than one location.
Archive, Star, Delete
- Archive
- remove the inbox label
- Star
- add a star
- Label
- like star but with a custom name
- Delete
- remove all labels and add a "Trash" label
Analyze
What kind of messages are you receiving?
Students were getting ten messages per day alerting them to various activity on the platforms we set up for them: digital classroom, communication blasts, attendance
Process
Inbox -> Starred -> Archive g i s e
Inbox -> Trash
Inbox -> Reply r
Stars and flags
- Starred is the activity section
- Multiple stars can represent different kinds of action
Filters
Inbox is a filter. A filter catches some values and let's others through. Inbox shows us messages that contain the metadata "Inbox".
Starred or flagged is a filter for all messages containing a metadata star or flag.
Rules
Notifications
Connections
Let's talk about running a computer lab
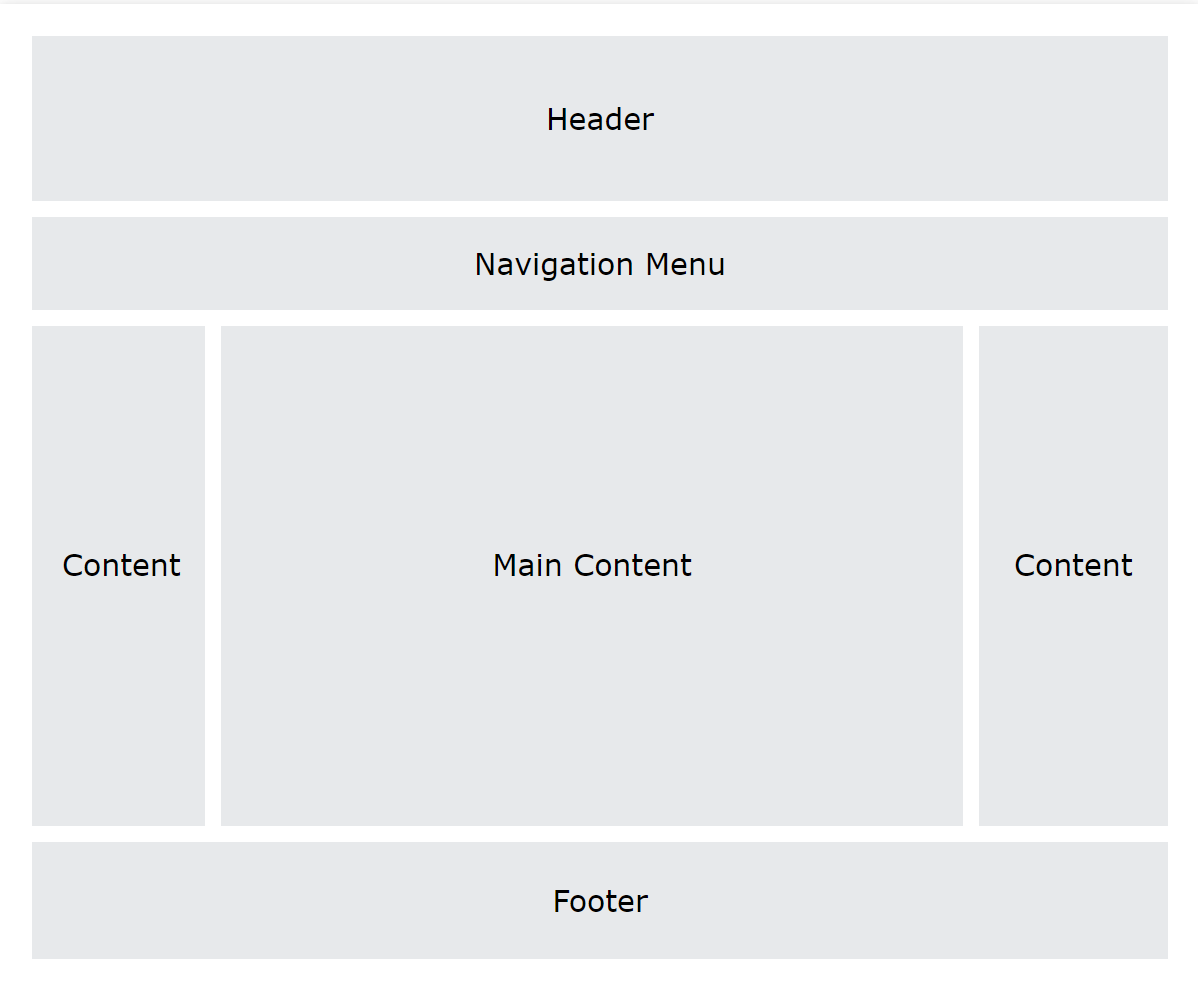
Room layout
Monitoring and Circulation
Structure
Rapport
Software
Debugging
Seating Charts and Pair Programming
Work products: analog and digital
Assessment: cultivating success
Computing in the news REDUX
Find the computer
Recall: computers consume data, transform data based on some instructions, and return a useful result
In each of these stories there is a computer. Find the computer by finding the data.
Articles
The Problems with Elon Musk's Plan to Open-Source the Twitter Algorithm MIT Technology Review Chris Stokel-Walker April 27, 2022
Elon Musk’s announced plans for the Twitter social network include open-sourcing its algorithms, which experts say would do little to boost transparency without access to their training data. Said Jennifer Cobbe of the U.K.'s University of Cambridge, "Most of the time when people talk about algorithmic accountability these days, we recognize that the algorithms themselves aren't necessarily what we want to see—what we really want is information about how they were developed." There also are concerns open-sourcing Twitter's algorithms would enable bad actors to identify vulnerabilities to exploit and could make it more difficult to defeat spam bots.
Articles
Method Makes Traffic Prediction Faster Futurity.org Matt Shipman May 5, 2022
North Carolina State University (NC State) researchers modified an algorithm developed to help simplify complex computing tasks to better anticipate traffic patterns in a specific place and time. The algorithm segments a bigger traffic forecasting model into a series of smaller problems that can be solved simultaneously. The process shortens the forecasting model's run time, while more complex questions tend to lead to higher levels of improved efficiency. The tweaked algorithm also enhances run time by allowing the model to realize when it has reached a solution that is within 5%, or even 10%, of the optimal solution. NC State's Ali Hajbabaie said the modified algorithm uses much less computer memory, and runs orders of magnitude faster, than a benchmark algorithm.
Articles
Open-Source 'Package Analysis' Tool Finds Malicious npm, PyPI Packages BleepingComputer Ax Sharma May 1, 2022
The Open Source Security Foundation (OpenSSF)'s prototype Package Analysis tool caught more than 200 malicious npm and Python Package Index (PyPI) packages in its initial run. Released this week on software development platform GitHub, the tool is designed to identify and counter malware in open source registries. OpenSSF's Caleb Brown and David A. Wheeler said the tool was developed to help users "understand the behavior and capabilities of packages available on open-source repositories: what files do they access, what addresses do they connect to, and what commands do they run? The project also tracks changes in how packages behave over time, to identify when previously safe software begins acting suspiciously." Most of the malicious elements the tool identified in its initial run were dependency confusion and typosquatting exploits.
Articles
Algorithm That Screens for Child Neglect Raises Concerns Associated Press Sally Ho; Garance Burke April 29, 2022
A review of an algorithm designed to screen for child neglect has raised worrying issues, including questions of reliability. Carnegie Mellon University researchers analyzed a tool used by Allegheny County, PA, which in its first years of use identified a disproportionate number of Black children for "mandatory neglect" probes compared to white children; social workers also disagreed with the algorithm's risk scores about one-third of the time. Critics say the algorithm gives data on poor people excessive influence in deciding families' fates, and they caution against local officials' increasing reliance on artificial intelligence. Advocates fear that if similar tools are adopted by other child welfare systems with little to no human intervention, they could compound racial disparities.
Computing innovation contracts
- Find the data in your computing innovation story.
- What data is consumed by the computer?
- How is the data transformed?
- What is result is produced by the computation?
- What concerns regarding data storage, data security, or data privacy are raised by this innovation?
- What potential benefit does this innovation promise?
- What potential harm might this innovation cause?
Let's talk about algebra
Equations
Computer science can help us use precision in our mathematical language.
What is an equation?
Have you ever refered to an equation as containing the answer?
Expressions
2 + 2 is an expression, it's value is 4 The answer is 4
2+2=4 is an expression that evaluated to true.
Solution checking and whether a given value turns an expression to a true statement.
Functions
Repeatable computational abstractions. The target of elementary and middle school mathematics is modeling and reasoning and expressions and equations standards are functions.
Equations are a catch all phrase in mathematics education that often includes what we mean by functions in algebra.
Notice what changes, collect and plot data, predict/interpolate values
Operators
Binary operators are given two arguments +, ×, ÷, -
Unary operators are given one argument \(a^b\), $sqrt{2}
Functions express operations as name and some any number of arguments
When we use name such as sum, difference, product, and quotient we are invoking the function.
A formula is a function
In math class we often refer to "formulas" like the formula for the volume of a cone.
Students "plug" numbers into the formula. Formulas are functions!
Plugging-in is applying a function forming an expression (or what excel calls a formula :/
Examples
A right circular cone has a height of 11 centimeters and a diameter of 7 centimeters. What is the approximate volume, in cubic centimeters, of the cone?
- What skill is being assessed?
- What is given (context)?
Let's talk about spreadsheets
Fundamentals
- Introduction to tables
- Categorical and quantitative data
- Viewing and creating filter views
- Conditions in filter views
Warm Up
Choose a question that speaks to you. Be prepared to say why you chose that question
- Which advisors are asked to make the most student outreach?
- Do malesor females receive a higher proportion of attendance comments?
- Whoare the "best" students in the 9th grade?
- Which students have the most improved attendance?
- Which words are most often used in comments about students?
- Are students with high attendance more likely to earn credit for classes?
- Is a student only missing my class?
- Did my outreach to a student's family two weeks ago positively affect the students attendance?
Objectives
Participants will be able to…
- name and describe the parts of given tables,
- and distinguish between types of data and data representations in a given table.
Data
- often means information about the world around us represented in a structure that can be read by computer
- data can often be represented as a table
- a spreadsheet is a program for interacting with tabular data
- programming languages can also manipulate tabular data
Data Rows and Columns
Tables are made up of data rows and columns
Tables
Data rows begin under the header, which contains the names of each column
Check for understanding
How many data rows does this table contain?
| column 1 | column 2 | column 3 | column 4 |
|---|---|---|---|
| data value | data value | data value | data value |
| data value | data value | data value | data value |
Activity
- Draw a circle around a column
- Draw an line through a row
- Draw an x over a column header
| Name | ID | Attendance |
|---|---|---|
| Andy Thomson | 73 | 100 |
| Xena Woodley | 30 | 100 |
| Lilianna Cabrera | 1 | 83 |
| Maurice Steadman | 29 | 96 |
| Sameera Yeoman | 75 | 75 |
Imagine data entities
Data entities are elements of our world that we might want to track as data.
Students in a school are often represented as a data point with a number of dimensions. Some of the dimensions (or attributes) associated with a student are attendance, credits, biographicals.
Brainstorm data entities from your own life.
Types of Tables
- Tables for Computers
- data collection tables
- often many rows
- not human readable
- one row per event
- Tables for Humans
- created from computer tables for humans
- summary (pivot) tables
- one row per category
Example computer table
Submitting attendance is an example of a table for computers
Checck for understanding
Describe the data entity in an attendance collection table.
| Student | Class | Date | Attendance |
|---|---|---|---|
| Student 1 | Intro to CS | 2022-04-30 | P |
| Student 2 | Intro to CS | 2022-04-30 | A |
| Student 3 | Intro to CS | 2022-04-30 | P |
| Student 4 | Intro to CS | 2022-04-30 | P |
| Student 5 | Intro to CS | 2022-04-30 | A |
Example of table for humans
A student level report for a parent conference is an example of a table for humans.
Check for understanding
| Student | Class | 1st Sem Attd |
|---|---|---|
| Student 1 | Intro to CS | 100 |
| Student 1 | English | 75 |
| Student 1 | Math | 93 |
| Student 1 | Science | 93 |
| Student 1 | History | 90 |
Categorical and Quantitative Data
- Categorical data
- describe attributes that represent categories to which the entity belongs
- cannot be used for arthimetics
- adding, subtracting, multipyling, and dividing don't make sense
- Quantitative data
- describe attributes that count or measure part of the entity
- can be used to for arithmetics
- adding, subtracting, etc. produce meaningful results
Categorical or Quantitative?
- Who is the oldest in a particular grade?
- Which students need attendance outreach?
- How many students have below 65% attendance in the 9th grade?
- Which cohort of students has the highest average assessment scores?
- Which zip code has students with the lowest attendance?
- Which advisor has the most students in need of attendance outreach?
- What is the average number of student logins to the online gradebook?
Subgroups
- Large amounts of data are more useful when broken up into different subgroups
- If I am a principal, I might want to see data relating to only certain classrooms.
- If I am a parent, I only want data about a particular student.
Breakout
- What are some examples of subgroups of your students?
- How are those students described in meetings?
- What data is used to identify these sub-groups?
Activity Overview
Filter Views Filter views represent subgroups of data.
- On the next slide you will recieve a link to some data about students.
- Find "Filter Views" in the Data menu
- You will see several saved views.
- Each filter view represents a subgroup of students
- You can edit, duplicate, and create your own filter views.
Student Data
Make a copy of student dataset The link about allows you to copy a one semester summary of student data.
Find "Filter Views" in the Data menu
Try these actions:
- Open a filter view for a saved subgroup
- Duplicate a filter view -> rename the copy
- Change a filter view by sorting a column -> verify that your change is saved
- Create a new filter view
Pivot Tables
- Pivot tables are summaries of large tables
- By grouping data together we can make a new table where each row entity is a summary of some part of the larger table.
Create a pivot table
Find "Pivot Table" in the Data menu
Choose a range to summarize (the default is the entire tab you are currently viewing"
You can create a new sheet or add multiple pivot tables to one sheet.
Choose Rows
Choose your columns to be some categorical data that represents a subgroup of the data.
Choose columns
For each row what attributes to want to investigate
Choose value
For each attribute how would you like to summarize it?
Cell References
Each cell is named by the absolute reference using the column letters first found at the top and row numbers second found along the side.
=A1 means get me the value from column A, row 1
Functions and Expressions (Formulas)
=function(values)
- An expression is when you apply a function to a value. The function does its job and gives back the result.
- Expressions are like a sentence with verbs and nouns.
- Verbs in a expression are called Functions
- Nouns in a expression are called Values
Function Contracts (protocols)
A contract is an agreement with the function. If we follow the contract, the function will do work for us. We need to give the function what is expected in its contract in order for it to do its work.
Type =concatenate
Click ? to see the function contract
What does concatenate expect to be given?
What will concatenate give back if you follow the contract?
Copy down formulas for an entire column
Most spreadsheet functions work on single values One way to apply a function to a range of values, such as all of the values in a column of data, you can copy down the formula by…
- CTRL+↓ or CTRL+↑ jumps to the top or bottom of a column
- Add SHIFT, CTRL+SHIFT+↓ to select all cells below
- Ctrl+D to copy down formula
- Formulas in spreadsheets are made to be copied down. Cell references will change unless you tell them not too.
Import Data
Student data csv download Download the file above or use a csv of your own student data
- Open or create a sheet.
- Find "Import" from the File menu.
- Choose the csv file for your data.
- Select an import option.
- Choose replace current sheet in most cases.
- Choose detect seperator automatically in most cases.
- Click import.
Named ranges
- Open a spreadsheet in Google Sheets.
- Select the cells you want to name.
- Click Data and then Named ranges. A menu will open on the right.
- Tip: To quickly open this menu, in the range box on the top left, click the drop down menu Down arrow > Manage named ranges.
- Type the range name you want.
- To change the range, click Spreadsheet Grid.
- Select a range in the spreadsheet or type the new range into the text box, then click Ok.
- Click Done.
Named ranges example
Assume you have the names firstcolumn and secondcolumn in your named ranges.
=arrayformula(concatenate(first_column, second_column)
Array BuilderNotation
Creating custom arrays You can also create your own arrays in a formula in your spreadsheet by using brackets { }. The brackets allow you to group values, which can be a single number, string or boolean, or a rangeof values.
Horizontal and Vertical Stacking
Use the following punctuation to arrange values in an array:
- Commas: Separate columns with a comma to arrange data horizontally. For example, ={1, 2} would place the number 1 in the first cell and the number 2 in the cell to the right in a new column.
- Semicolons: Separate rows with a semicolon to arrange data vertically. For example, ={1; 2} would place the number 1 in the first cell and the number 2 in the cell below in a new row.
Try on your own.
Arrayformula
Example: Operators vs Function
Recall the distributive property
\(a(b+c) = ab + ac\)
Compare the results of
=arrayformula(a:b&b:b)
to
=arrayformula(concatenate(a:a,b:b)
Filter and sort functions
=FILTER(data, boolean-mask-to-apply-over-that-data)
Formulas in filters expand like an array formula
Match an index
Concatenate text with map
Let's talk about data science
Using a programming language to produce meaningful results with data
Pyret Starter File
Student Data Starter File Open the link above. You will see a Pyret program that loads data from our student google sheets example. This starter file uses a libray from the Bootsrap:DataScience curriculum to simplify some of the table and charting operations. Consult the curriculum workbook for a full list of the contracts available.
Tables and Row Accessors
Visualizations
Pie-chart
pie-chart(students-table, "iep)